Outline of Musashino City 2012 page 54/58

このページは Outline of Musashino City 2012 の電子ブックに掲載されている54ページの概要です。
秒後に電子ブックの対象ページへ移動します。
「電子ブックを開く」をクリックすると今すぐ対象ページへ移動します。
概要:
Outline of Musashino City 2012
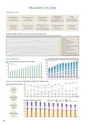
Musashino City DataResident’s LifeSize of Residence(January 1, 2011)37.8 m 2 Per ResidentPark Area *Municipal parks(April 1, 2011)1.6 m2 Per ResidentMedical Facilities(March 31, 2011)1 Per 377 ResidentsSchool Grounds*Municipal schools (May 1, 2011)Per StudentElementary School: 15.9 m 2Junior High School: 24.0 m 2Shops(July 1, 2009)Wholesale and Retail1 Per 35.1 HouseholdsLibrary Books(March 31, 2011)5.4 Per ResidentDoctors *Including Dentists(October 1, 2008)1 Per 203 ResidentsTeachers *Municipal schools(May 1, 2011)1 Per 18 Elementary School Students1 Per 14 Junior High School StudentsFire Department Workers(April 1, 2011)1 Per 760 ResidentsCity Employees(April 1, 2011)1 Per 157 ResidentsRanking of Public Priorities of the City’s Services (Time-Series Plot)Note: Due to different notations utilized each fiscal year, similar measures are grouped into one item using the notations of FY2011 as the benchmark.81-82-83-844854862873883893902912922931941951961971981991001011021031042052062072081092101111FYElderly WelfareItem11111111111122359109777433332122Bicycle (Traffic) Measures11-9-4-5-6-6-5-10-12-12-14-13-9-12-2-3-6-6-8-11-13-153112111514141439511434Disaster Response and PreparednessEnsuring Safe Living222224444757108109754534659886335Planned City Development (Around Train Stations)12-14-1014111098138127135959898981341341451341381181251246889810494105959511675667Children and Youth MeasuresTraffic System and Road Improvement15-12-11-71271271191491511161114121311148147148138144127126116849511397668116107784107889Health PromotionElementary and Junior High School Education46129111087744433422222225101215141611910Environmental and Waste Measures (Waste Reduction)Social Security5000Welfare Recipient Households and People(Householdsand People)1,9352,000People1,793Households1,6511,556 1,579 1,5931,6011,4701,4801,5001,3341,278 1,301 1,3161,3611,219 1,1961,1311,0591,0918919309781,0011,000930868799729 76080765696 97 98 99 00 01 02 03 04 05 06 07 08 09 2010 (FY)Health and SanitationNumber of Medical Facilities(March 31, 2011)Hospitals10General Clinics198(People)35030025020015010050(ton)6,000Number of Deaths by Leading CausesNumber of People Certified as Requiring Long-Term Care(or Support) under the Long-Term Care Insurance SystemLong-termLong-term care5Long-termLong-termLong-termcare54,272 Long-termcare5Long-term care5 care5 care5Long-termcare5Long-term care43,797 Long-termLong-termLong-termLong-termcare4care5care4Long-term care4Long-termcare4care43,404 Long-termLong-term care4Long-termcare53,063care4care34,569 4,837 (March 31 of each year)5,4225,1894,770 4,868 4,982Long-termcare5Long-termcare4Long-termcare3Long-termcare2Long-termcare1Long-termcare5Long-termcare4Long-termcare3Long-termcare2Long-termcare1Long-termcare4Long-termcare3Long-termcare2Long-termcare1Long-termcare3Long-termcare2Long-termcare1Long-termcare3Long-termcare2Long-termcare1Long-termcare3Long-termcare2Long-termcare1Long-termcare3Long-termcare2Long-termcare1Support2Long-termcare3Long-termcare2Long-termcare1Support2Long-termcare3Long-termcare2Long-termcare1Support2Long-termcare3Long-termcare2Long-termcare1Support2Long-termcare2Long-termcare1Support2Support Support Support Support Support Support Support1 Support1 Support1 Support1 Support1001 02 03 04 05 06 07 08 09 10 2011(Year)Note: Classifications from 2007 are based on the revision made to the system in April 2006.324328 334315298301288276 274277264255261265269Malignant neoplasms (cancer, etc.)208Heart disease183190169179168 172177155157161160 162143135129 Cerebrovascular disease109117119109 109127107113116126103102 102 1068271 74 102106787693 92948395828190Pneumonia96979899000102030405060708092010 (Year)Waste Emissions by Type(People)6,0005,0004,0003,0002,0001,000Burnable garbageNon-burnable garbageBulky wasteRecyclablesHazardous wasteBusiness-related burnable garbageDental Clinics149Midwifery Homes45,0004,0003,0002,0001,000014,295668,1261,8435,22026,06814,251699,1011,8714,83024,83015,818669,5251,6094,71624,50415,220659,1361,5204,66224,02413,543 13,812 12,802 11,706 11,6011028,5101,4934,75810011,0351,5623,14912,9281,6091,35323,523 21,910 21,83812,8341,4441,34822,45512,4341,4641,32699 00 01 02 03 04 05 06 07 08 09 2010 (FY)981019821,88811,2819411,4761,3881,35121,6969,7859,5629810010,99211,0201,3951,3841,2081,27221,23021,33252