Outline of Musashino City 2012 page 5/58

このページは Outline of Musashino City 2012 の電子ブックに掲載されている5ページの概要です。
秒後に電子ブックの対象ページへ移動します。
「電子ブックを開く」をクリックすると今すぐ対象ページへ移動します。
概要:
Outline of Musashino City 2012
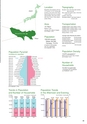
JapanLocationMusashino City located at 139°34’10”E and 35°42’53”N (City Hall)borders on the west of the TokyoSpecial Ward Area and is locatedapproximately 12km west of ShinjukuSub-Center (Tokyo MetropolitanOffice).TopographyElevation: 50m?65m (City Hall: 56.98m)above sea levelSize: 6.4km from east to west, 3.1km fromnorth to southLandform: Plain land.Geological feature: Loam layer (made ofvolcanic ash)Musashino CityTokyo10.73km 2AreaRanks 777thamong 787 cities of Japan(As of October 1, 2011)Population138,650 peopleMales: 66,580Females: 72,070of which 2,149 peopleare non-Japanese.(As of September 1, 2012)TransportationJR Mitaka Station?Tokyo Station: 28 minJR Mitaka Station?Shinjuku Station: 14 minJR Mitaka Station?Tachikawa Station: 13 minInokashira Line, Kichijoji Station?Shibuya Station: 16 minAverage Daily Ridership By StationJR Kichijoji Station: 276,840 peopleJR Mitaka Station: 180,428 peopleJR Musashisakai Station: 123,332 peopleKeio Kichijoji Station: 142,083 peopleSeibu Musashisakai Station:28,142 people(FY2010)Population Pyramid(including non-Japanese)Age 85 and older1,396 peopleAge 80-84men1,772 peopleAge 75-792,385 peopleAge 70-742,810 peopleAge 65-693,307 peopleAge 60-644,345 peopleAge 55-593,571 peopleAge 50-544,271 peopleAge 45-495,080 peopleAge 40-445,810 people3,208 people2,815 people3,428 peoplewomen3,469 people3,980 people4,502 people3,786 people4,408 people5,125 people5,985 people12,675 people/km2 Population DensityRanks 2nd out of 787 cities of Japan(As of October 1, 2011)Number ofHouseholds72,462 households1.9 people per household(As of September 1, 2012)Age 35-396,016 people6,022 peopleAge 30-346,034 people5,940 peopleAge 25-295,429 people5,619 peopleAge 20-243,809 people4,085 peopleAge 15-192,683 people2,524 peopleAge 10-142,651 people2,259 peopleAge 5-92,444 people2,388 peopleAge 0-42,767 people2,527 people(As of September 1, 2012)Trends in Populationand Number of Households(People)150,000120,000Total Pop.131,675peopleTotal Pop.133,722people(As of January 1 of each year)Total Pop.134,422peopleTotal Pop.135,809peoplePopulation Trendsin the Afternoon and Evening(People)150,000(As of October 1 of each year)153,379152,586143,994138,598138,109134,510114.0152,425135,730154,448137,513(%)90,00063,965men64,797men64,960men65,217men100,000110.5112.3112.311060,00030,000066,302households67,710women68,674households68,925women70,150households69,462women70,854households70,592women2003 2006 2009 201250,0000103.9Afternoon Population÷Evening Population1985 1990 1995 2000 2005Evening PopulationAfternoon Population10003